Beautiful data, critical to understanding people and teams
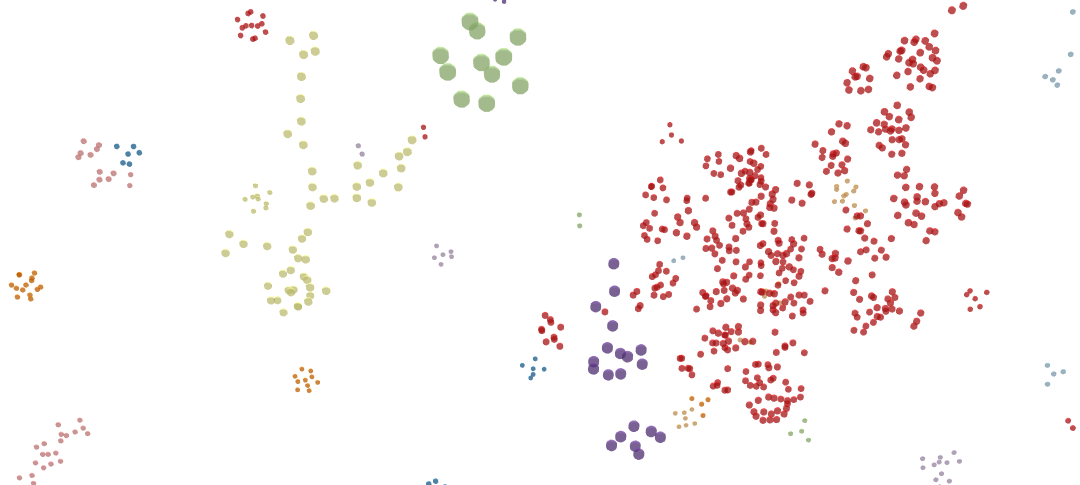
We live in a truly fascinating and complex world. People, in particular, never cease to surprise us – both in good and bad ways! At Jyre we embrace the complexity and diversity of people, and we’re naturally curious about what data can tell us about them. We can’t help but look at a network diagram of our viewpoints ‘universe’, below, without wondering what causes the patterns and trends that we can see clearly emerging before our eyes. (Click on the image to explore it in full 3D)

3D network visualisation of the Jyre Viewpoints Network. Click the image to explore in full 3D.
Beyond curiosity, there are also pressing, urgent questions that our work asks of us. Challenges that we face around performance, diversity, and growth. And often, the answers lie in our people. But figuring out the right answers as business leaders can sometimes feel like divining for water. It’s so tempting to look for clear-cut answers. But genuine data on real people is rarely clear-cut: it’s rich, nuanced, beautiful, and subtle. Trends and correlations tend to be modest. Rather than shouting at you, the data whispers. But by listening carefully, with an open mind, it can give you a significant edge. Not clear-cut answers, but a 20%, 60%, or 70% edge.
Diversity of teams
We work with a lot of teams, and naturally we get to see a great deal of diversity and richness. We see ‘teams’ which might perform better as separate cohesive sub-teams; teams oozing diversity but lacking a shared foundation; teams with a clear set of shared values but lacking resilience and diversity in an environment where it’s clearly needed. Data, whether it be a team solo or viewpoints report, a visualisation or bespoke analysis, prompts the conversation and leads to action where it’s needed.
Showing a team their ‘similarity’ network, like the one below, is truly fascinating. It’s a chance for a team to have a conversation about their specific diversity – a conversation grounded in fact. What does the structure of the team feel like? I look like an outlier; what does that mean to our team in practice? We’re thinking about hiring X; how would that look, and what would it mean for us as a team? Network diagrams like this are great for showing clusters, cohesion, diversity and outliers. Like the greatest teachers and coaches, well-presented data won’t give us easy answers, but it can prompt us to ask the powerful questions that need asking.

Network Similarity Diagram for the Jyre Team (as of 2019)
This is the ‘similarity’ network for our core team at Jyre, simply showing members who are more similar in character as closer together, and those more different as further apart. You might say that the team is grounded at one end by our key founder, Mark Loftus. But there are so-called ‘outliers’ – like Lisa and Dan, who work quite differently, with different and complementary sets of strengths. This team functions well because of that diversity. Interestingly, we have noticed that dissimilar pairs tend to work remarkably well within a team (a subject for another time)!
Organisational insight
Stepping up a level from teams to the organisation, we get a different perspective. Teams become points of reference, individuals become anonymous but crucial ‘data nodes’, and we can look at our people in a number of fresh ways. As business leaders, we can start to ask questions about the relationships between teams and, crucially, about the effectiveness of our organisation as a whole. What are our key strengths? Our gaps? The violin plot below gives an example of how we might understand our organisation’s critical ability to maintain direction, compared to another division or organisation.
Spot the difference – a violin plot comparing ‘Sets Direction’ across two organisations
The power of data
Exploring data, especially in a visual way and with an open mind, can truly open us up to insights and lead to effective action. We know that it grounds us in reality, and if we stay honest, it can give us the ‘brutal facts’ (to coin James Stockdale’s phrase) that free us to actually make the best decisions. That might mean adjusting the way you hire, re-imagining your performance review process, having fresh conversations as a team, or deciding to take your own personal growth in a new direction. At least with the right data, the power is in your hands.